
Back to “Basic Trigonometry” Page
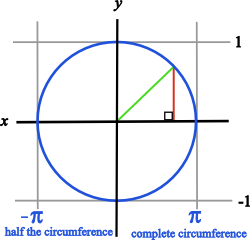
You will first notice a circle in the diagram at right. Now, notice that the green line equals the radius of that circle which is 1. Now, notice that the red line forms a right angle with the x axis. You can also see that the green line forms the hypotenuse of a right triangle.
Recalling the word SOHCAHTOA, you will notice that the sine of the angle at the origin (0, 0) equals opposite/hypotenuse or y/1. You can also deduce that the cosine of the angle at the origin (0, 0) equals adjacent/hypotenuse or x/1. Therefore the sine equals y, and the cosine equals x if the radius equals 1.
 You remember that the circumference of a circle equals 2πr. So half the circumference equals π times the radius. Notice that the x values in the diagram are denoted as π and negative π. The distance between π and negative π is 2π, because the circumference of a circle with r = 1 is 2π.
What Does a Circle Have To Do with a Sine Wave?
When we graph a sine wave, we are plotting the x and y values starting at zero and moving to the right instead of sweeping constantly around the origin as we do in a circle. By doing this we will have exactly one y that corresponds to a given x which is the definition of a function. The result is a graph like the one below.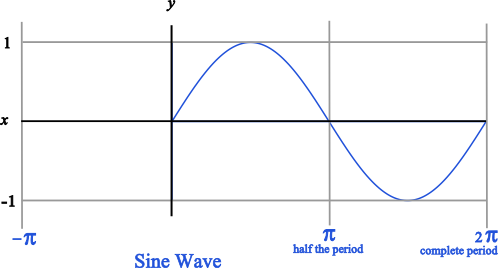
Likewise, when graphing a cosine wave, we get a graph that looks like the one below. Notice that the cosine wave starts at y = 1 because the amplitude of the cosine wave corresponds to the length of the horizontal leg of the right triangle. The sine wave starts at y = 0 because the amplitude of the sine wave corresponds to the vertical leg of the right triangle. 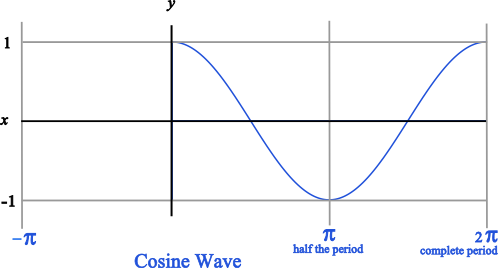
Just remember that the sine wave starts and y=0 and that the cosine wave starts at y=1.
The animated graphic below demonstrates how a geometric figure (circle) becomes a function (wave) by changing the method of plotting.
The animated graphic below demonstrates the same process with a cosine wave.